|
|
 |
|

|
|

|
|
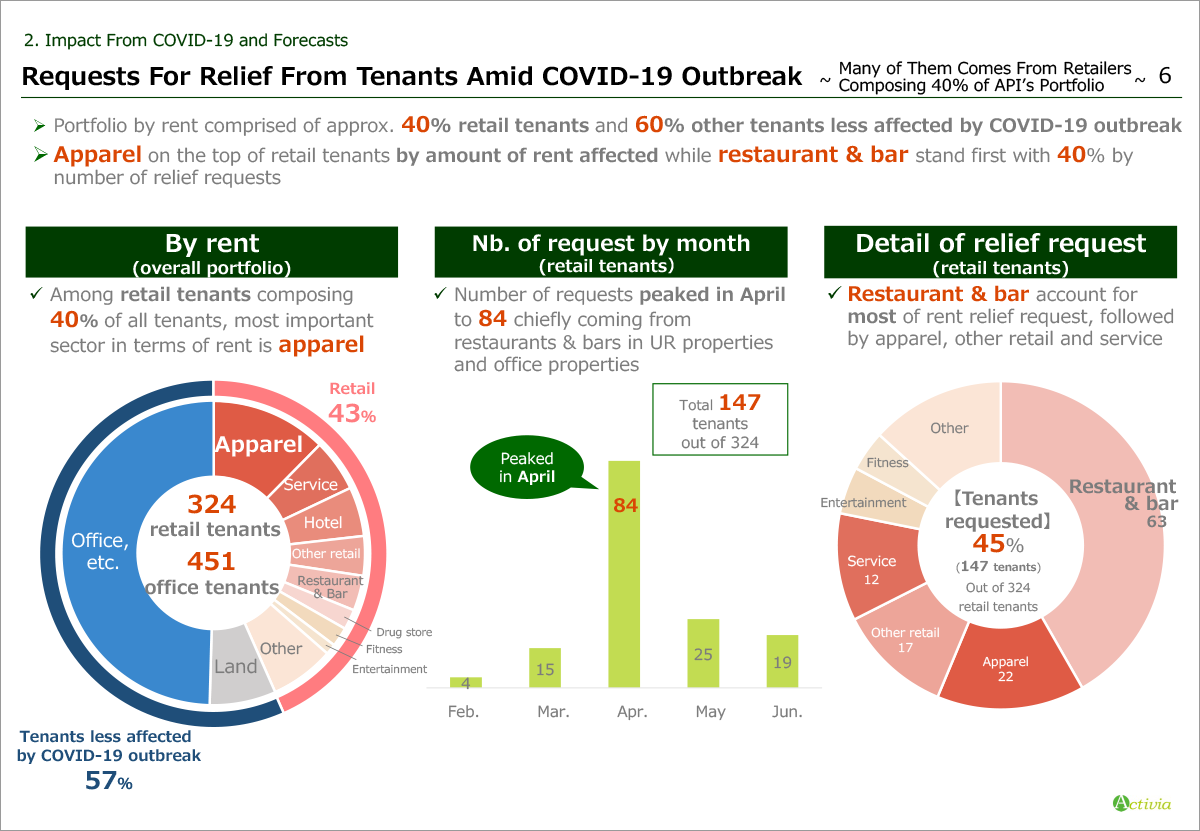
Slide 6 shows our situation around relief requests coming from tenants including breakdown of tenant business category by rent as well as request detail such as rent reduction and deferral.
On the left, the pie chart shows breakdown by rent of API’s overall tenant categories with major classification such as office, etc., retail and land.
Office, etc. and land, those two which are less affected by COVID-19 pandemic account for approximately 60%, and retailers account for the remaining 40%.
The retailer businesses are broken down in the inner-circle. Apparel stands on the top, followed by service, hotel, other retail and restaurant & bar.
In the middle, graph shows the transition of number of relief requests came from retail tenants.
Number of relief request peaked to 84 in April where a state of emergency was declared, and the total number amounted to 147 by June, coming from 45% of our retail tenants.
Pie chart on the right side shows the retailers who requested reliefs broken down by their business category.
Restaurant & bar stands out with approximately 40%, although their impact on our portfolio earnings will not be that significant as their proportion on total rent revenue is small.
|
|
|